Hello Friend,
Here, I am going to explain you, how you can check the analytics of your popups and bar.
It is very important to know, how you are performing and how your audience are reacting on your popups.
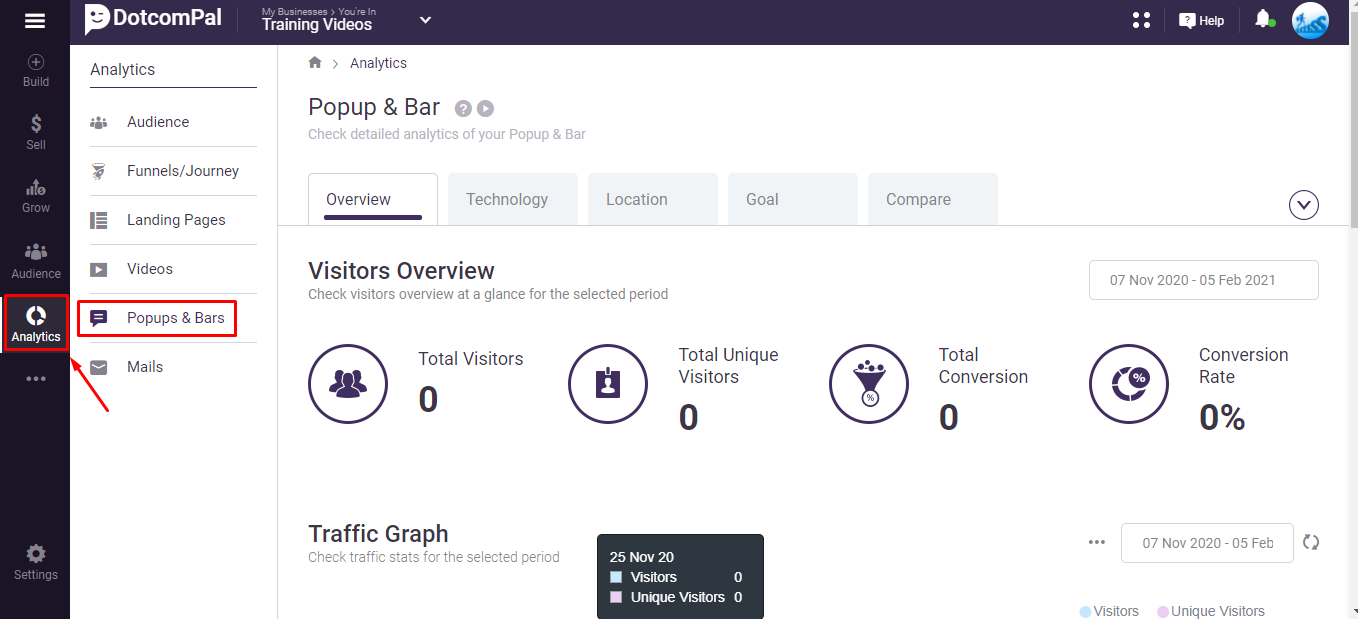
We will check the analytics of pop-up so click on this Analytics option from the dashboard and select on Popups & Bars option.
Here, we will be able to check the Overview, Technology, Location, Goal and Compare.
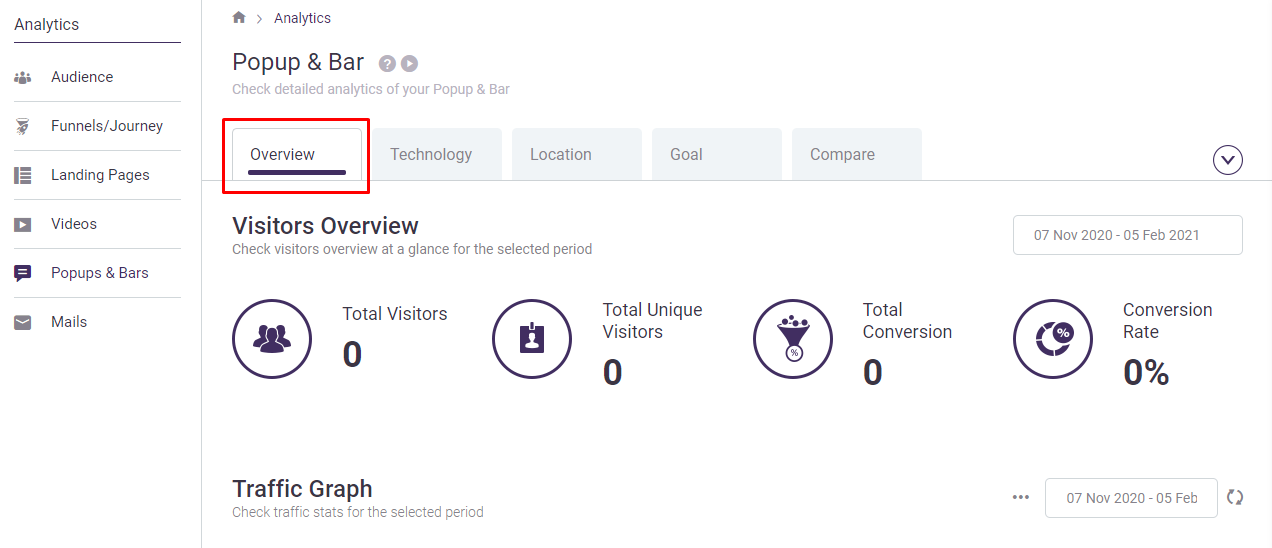
First, let's talk about the Overview.
You can check the Visitors Overview such as Total Visitors, Total Unique Visitors, Total Conversion and Conversion Rate.
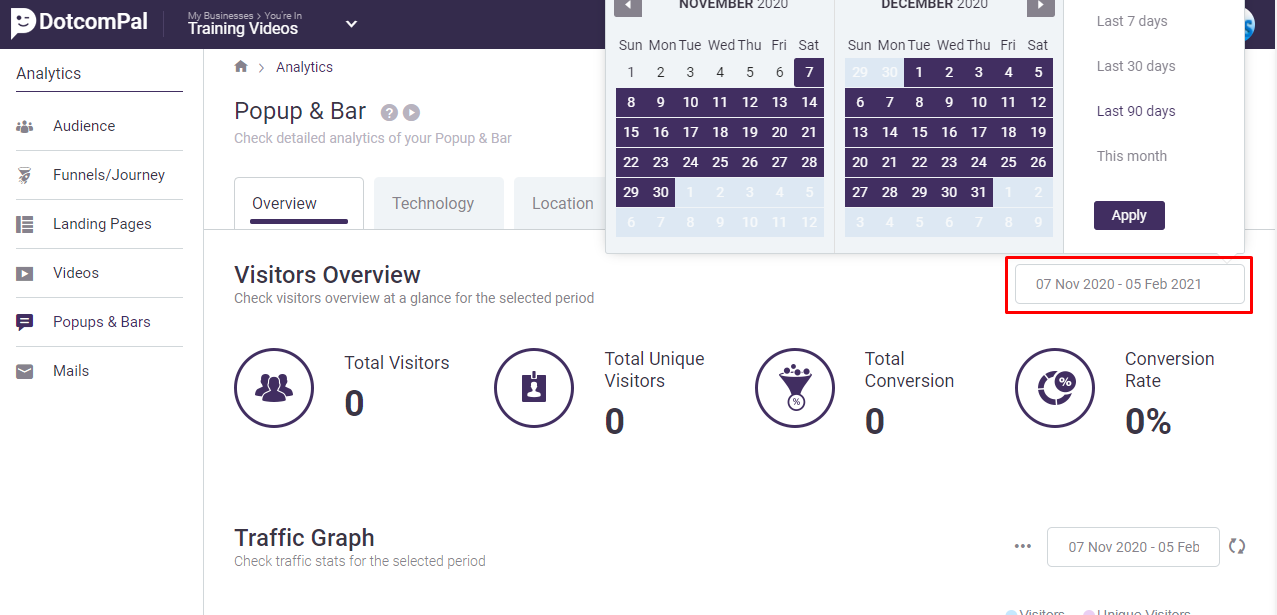
You can also apply this calendar filter to check the results for a desired date.
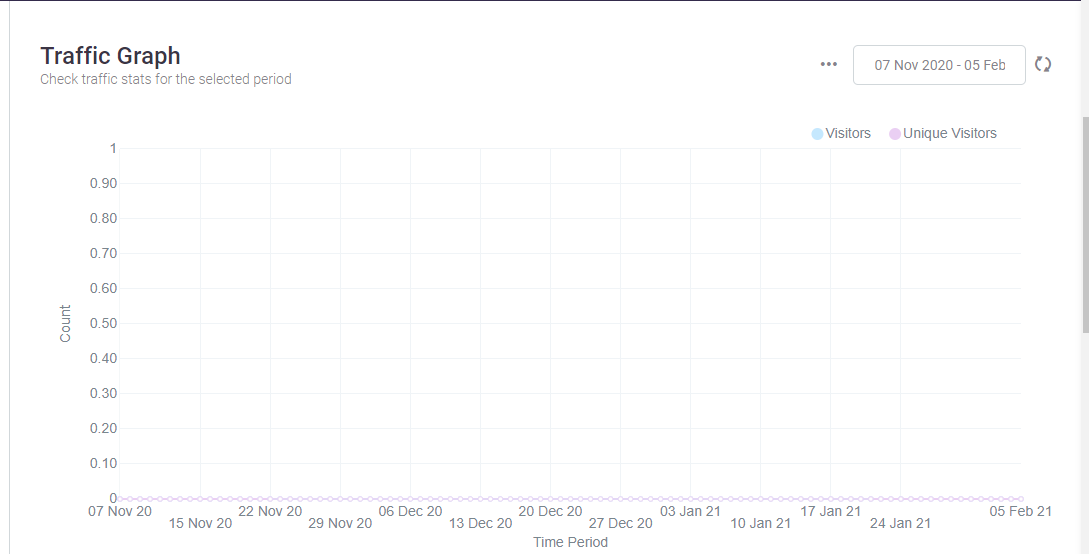
Below this you can check the Traffic graph, this will give you the analytics between visitor and unique visitor.
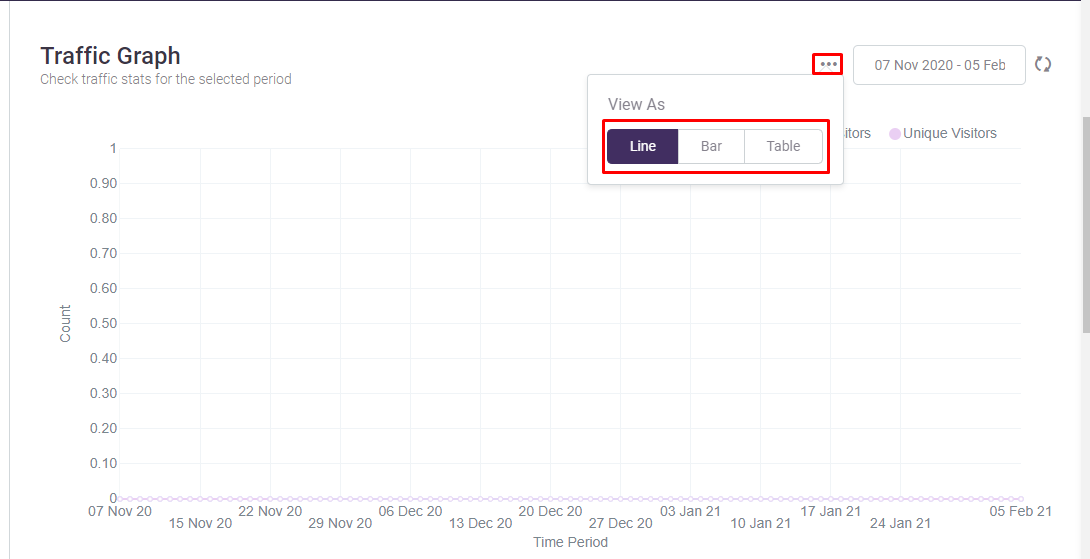
You can click on the Ellipsis/three dots option to check the graph in form of Line, Bar and Table graph form. You can also apply the calendar filter here to check the results for a certain date.
After that you will see the All Campaign section where you will be able to check stats of all the campaigns created under this project.
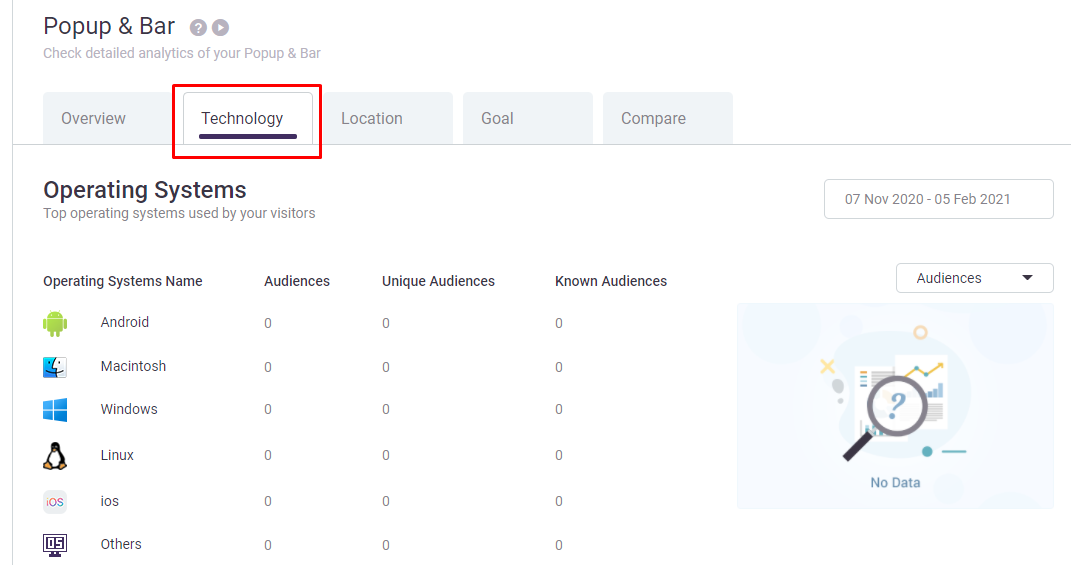
Now, let's move to the Technology analytics for your popup. Here, you will be able to check what Operating systems, Browsers and Devices used by your audience to visit your popup.
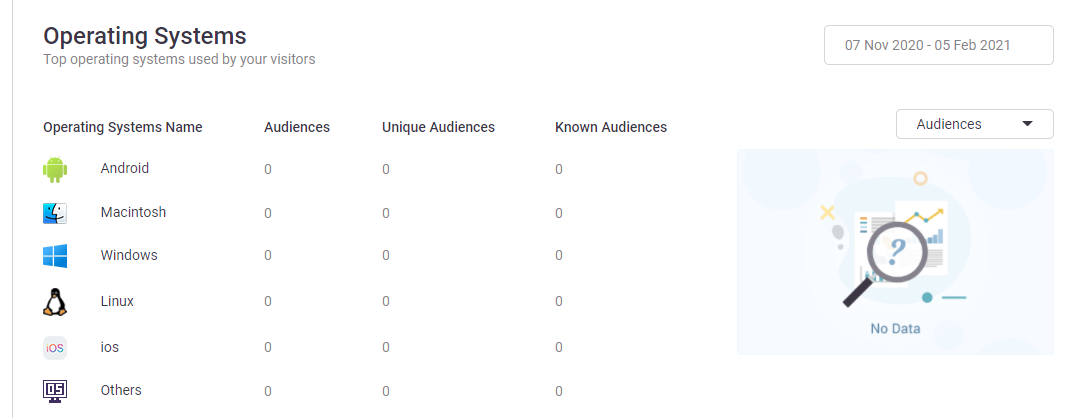
First, you can see Operating System used by your visitor here. You will be able to check Operating Systems Name, Audiences, Unique Audiences and Known Audiences..
You can also apply the calendar filter here to check the results between certain dates. You can also apply the filter to check the Audiences, Unique Audiences and Known Audiences.
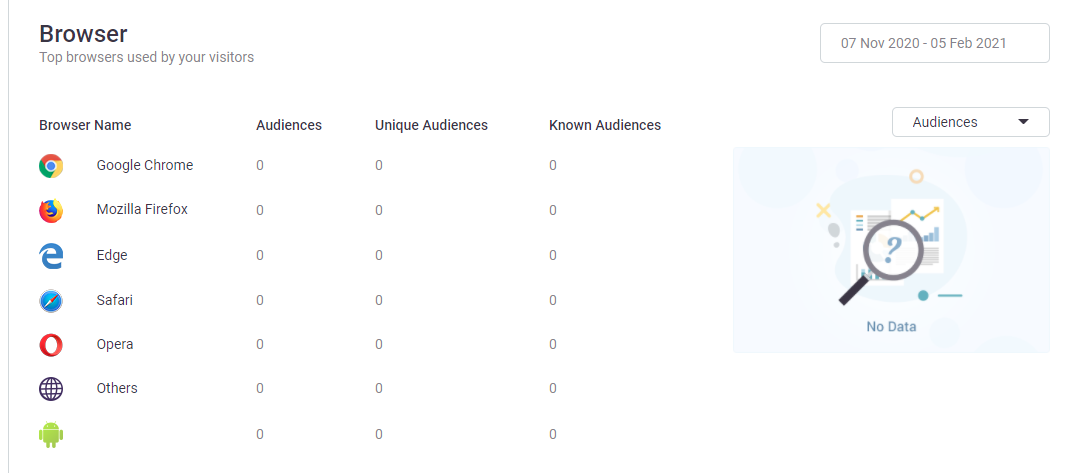
Below this you can see Browser used by auidience for your popups. You will be able to check Browser Name, Audiences, Unique Audiences and Known Audiences.
You can also apply the calendar filter here to check the results between certain dates. You can also apply the filter to check the Audiences, Unique Audiences and Known Audiences.
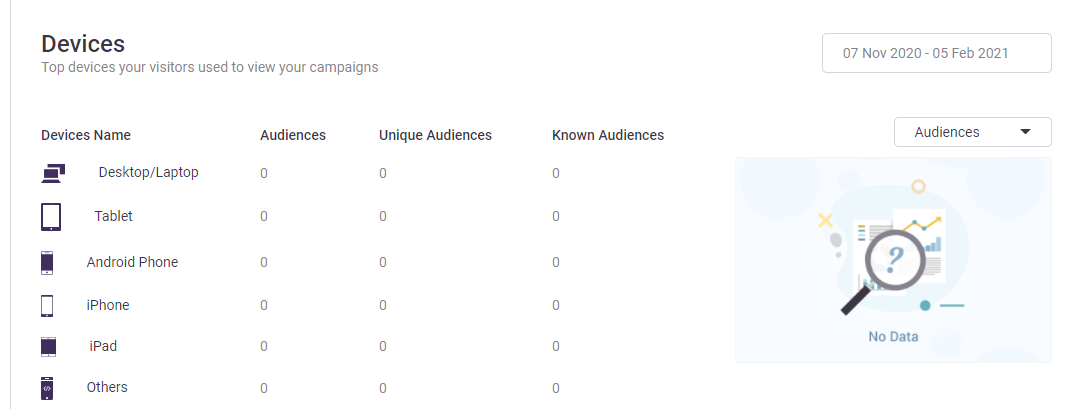
Below this you can check the Devices used by your visitor to visit the popups. You will be able to check their Devices Name, Audiences, Unique Audiences and Known Audiences.
You can apply the calendar filter here also to check the results between certain dates. You can also apply the filter to check the Audiences, Unique Audiences and Known Audiences.
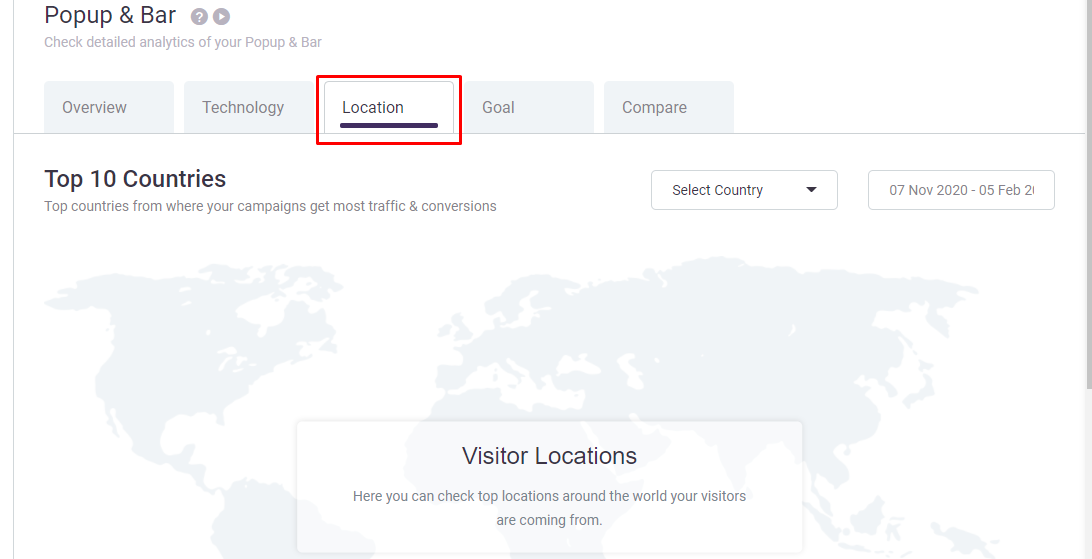
Now, let's check the Location of your visitors from where they are visiting your popups. Here, you will be able to check the top ten countries from where your popups and bars are getting most of the traffic and conversion.
You will be able to check Country Name, Audiences, Unique Audiences and Known Audiences.
You can also apply the calendar filter here to check the results between certain dates.
To deeply understand your viewers' behavior with your popup and bar you can check the State name, City name from where your viewers are coming.
Here also you can apply the calendar filter here to check the results between certain dates.
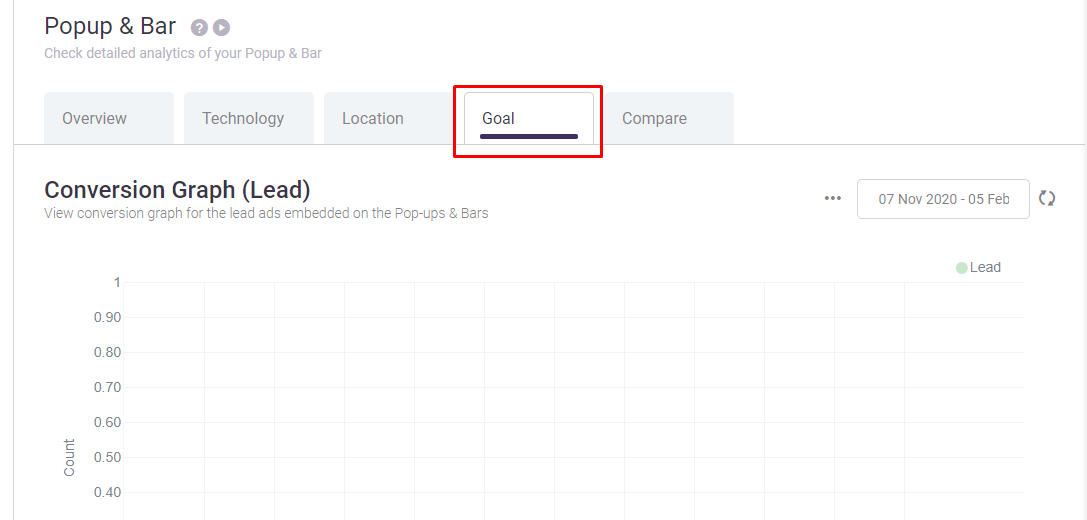
Let's check the Goal section now. When you set the goal, for your popup and bar from the settings inside the DotcomPal popups and bar editor, you can check their conversion graph here.
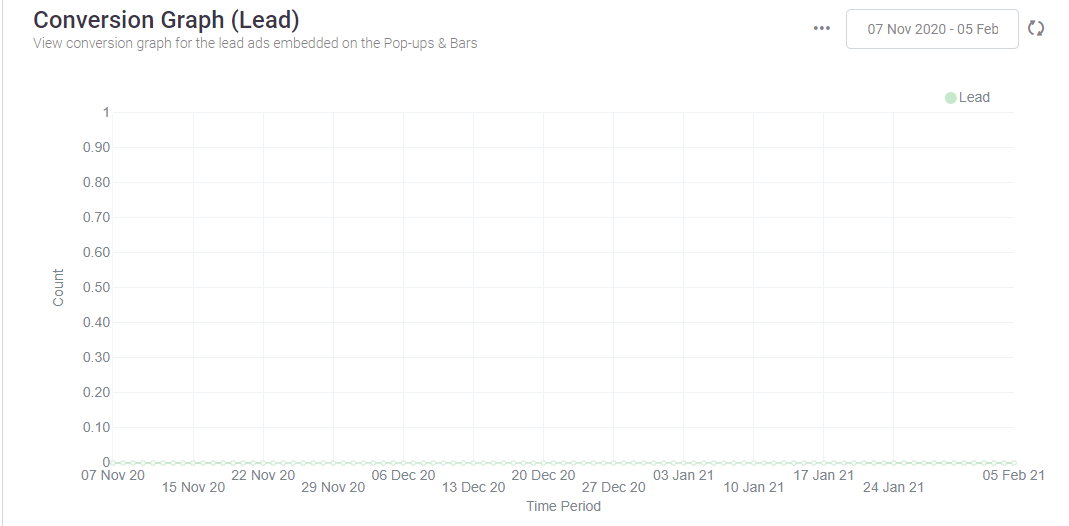
First, we will the check the Conversion graph for Lead Generation Goal.
If you have set the goal as lead generation, then you can check here day by day lead generation report.
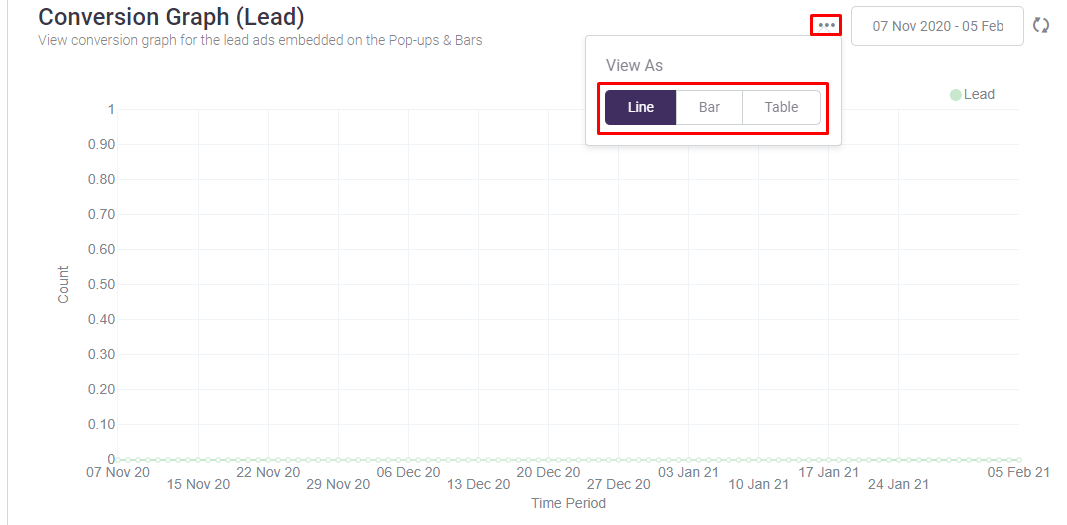
You can also check this graph in form of line, bar and table form.
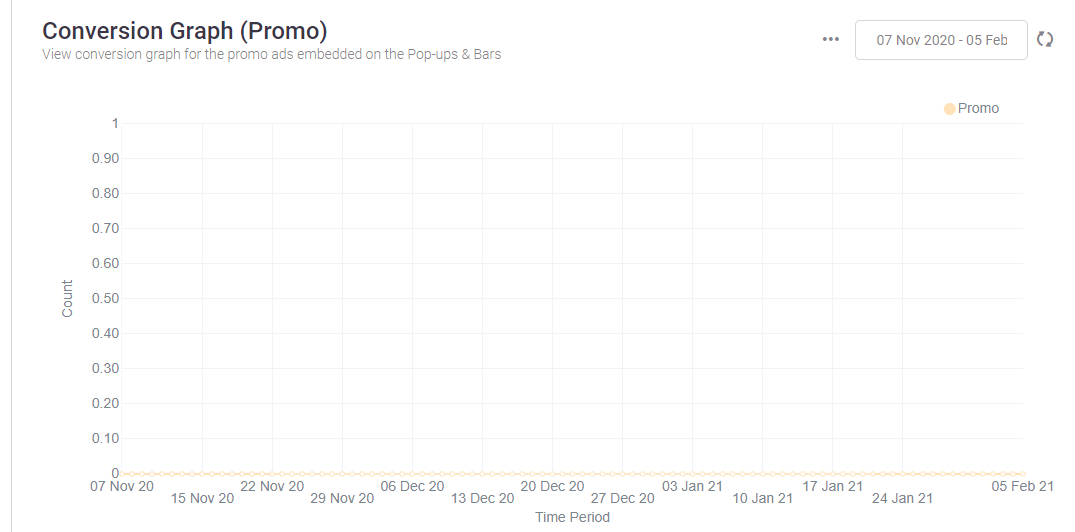
Below this, we will be able to check the Conversion Graph for Promotional Popup and bar. This will show us day by day promo conversion report. You can also check this graph in form of line, bar and table form.
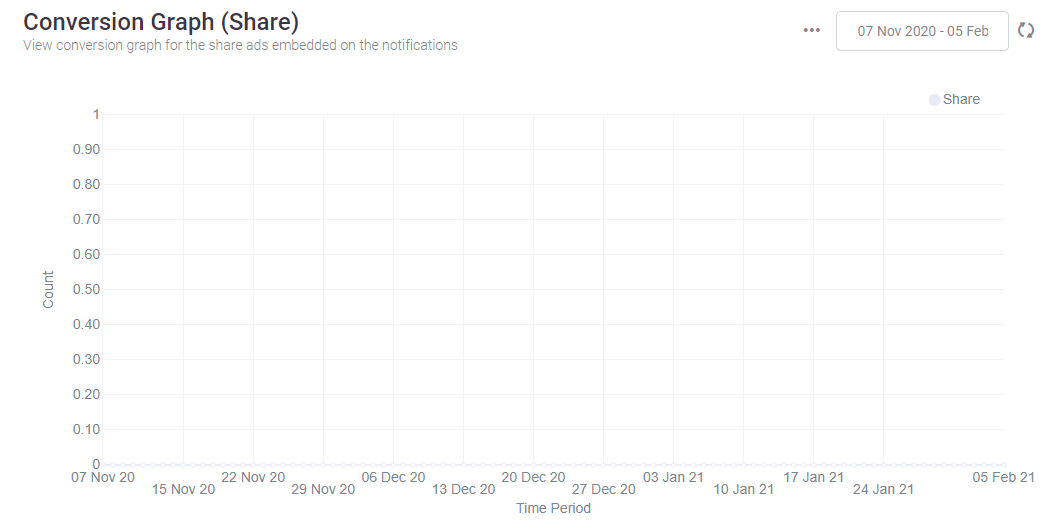
Let's move forward to check the Conversion Graph Share. This is for the share ads embedded on the notifications for your Popups and bars.
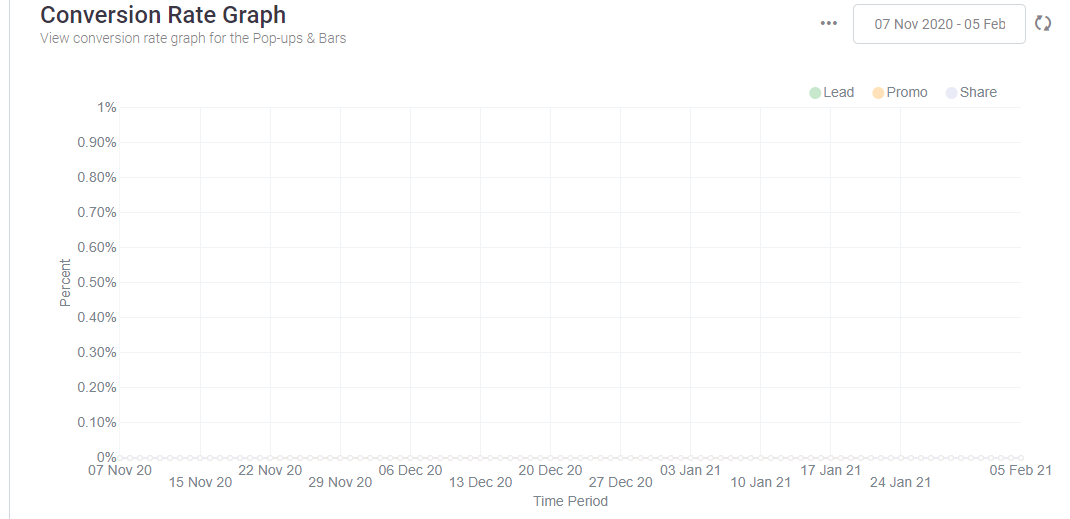
Below this, we will be able to check the Conversion Rate Graph.
This graph will provide you the conversion rate for lead, promo, and share on your popup for everyday.
Now last is Compare. In which we can compare the statistics of any two project.
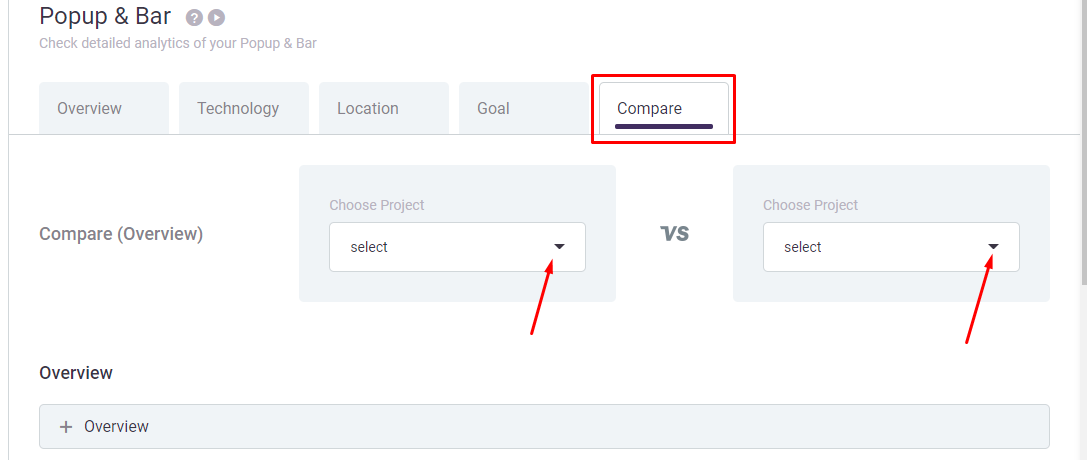
Select the projects you want to compare from here..
You will get the complete comparison report like Overview, Technology like operating system, browsers, devices and Location for both projects.
So, this is how you can check the complete analytics of your Popup and bar in DotcomPal.
I believe this was helpful.
Was this article helpful?
That’s Great!
Thank you for your feedback
Sorry! We couldn't be helpful
Thank you for your feedback
Feedback sent
We appreciate your effort and will try to fix the article